The efficacy of Relative Strength Index (RSI) in KLSE market trade
Article Sidebar
Main Article Content
Abstract
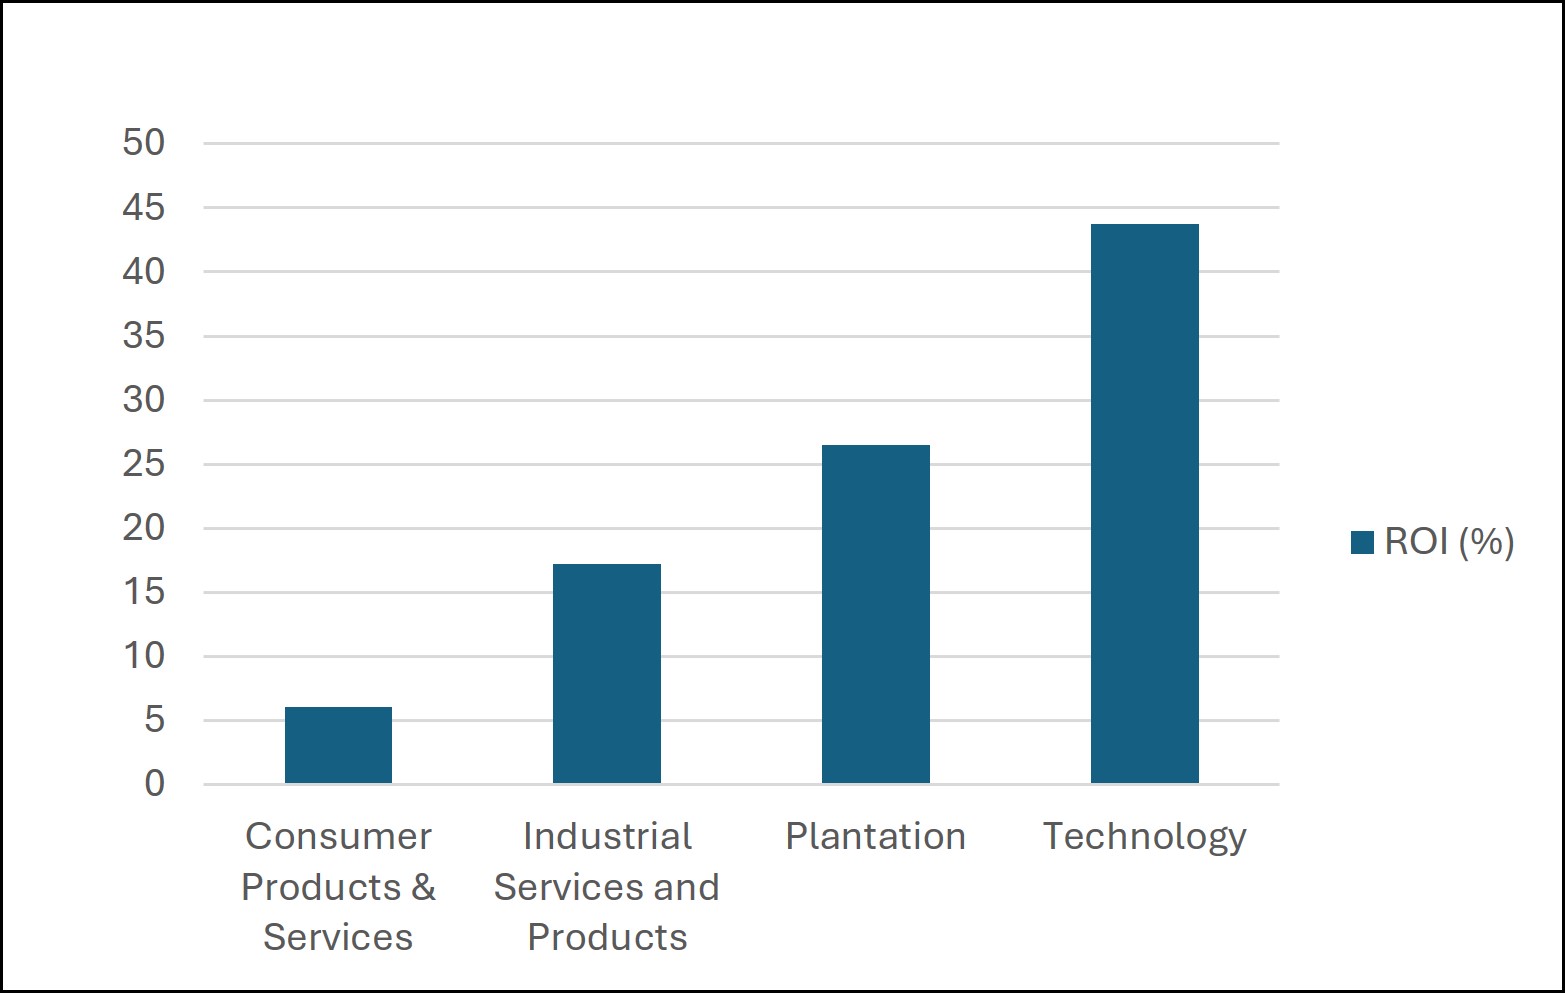
The Relative Strength Index (RSI) is a widely used technical indicator in stock trading because of its simple application. However, its application combined with fundamental analysis in Kuala Lumpur Stock Exchange (KLSE) is yet to be explored extensively. Hence, this study aimed to investigate the effectiveness of RSI as a predictive tool in the KLSE market. First, 39 stocks that met the set of criteria guided by fundamental soundness were identified. Trading signals are then initiated based on the RSI indicators, which are superimposed on the charts of the identified stocks. The return on investment (ROI) was then estimated and benchmarked against KLCI performance over a period of five years starting from 21st July 21, 2018. It was found that the average ROI was 3.46% against KLCI’s -24.37% over the same period of 5 years, measured between 21st July 21, 2018, 21st July 21, 2023. The average ROI improves as the number of trade iterations increases to five. The peak average ROI is approximately 22%. Technology is the top performer, recording an ROI of more than 40%. In conclusion, the combination of RSI and fundamental analysis yielded a mixed set of results. Although it outperforms KLCI, the annualised ROI is only slightly above 4%. Nevertheless, the results of this study provide valuable insights into the application of the RSI as a trading signal generator in the KLSE market.
Article Details

This work is licensed under a Creative Commons Attribution-NonCommercial-NoDerivatives 4.0 International License.
References
Ahmad, Z., & Ibrahim, H. (2002). A study of performance of the KLSE Syariah index. Malaysian Management Journal, 6(1&2), 25-34.
Baresa, S., Bogdan, S., & Ivanovic, Z. (2013). Strategy of stock valuation by fundamental analysis. UTMS Journal of Economics, 4(1), 45-51.
Bursa Malaysia. (2023). Listing criteria. Bursa Malaysia. https://www.bursamalaysia.com/listing/get_listed/listing_criteria
Chin, L. C., Sek, S. K., & Tan, Y. T. (2018). A Sectorial Performance Analysis of Kuala Lumpur Stock Exchange (KLSE, Bursa Malaysia), 1-14.
Drakopoulou, V. (2016). A review of fundamental and technical stock analysis techniques. Journal of Stock & Forex Trading, 5(1), 1-8.
Fam, C. L., & Mohamad, M. (2022). Technical Analysis of Malaysia Stock Performance. Enhanced Knowledge in Sciences and Technology, 2(1), 332–341.
Gupta, G. S., Khoon, C. N. H., & Shahnon, S. (2001). How many securities make a diversified portfolio in KLSE stocks. Asian Academy of Management Journal, 6(1), 63-79.
Jakpar, S., Tinggi, M., Tak, A. H., & Chong, W. Y. (2018). Fundamental analysis vs technical analysis: The comparison of two analysis in malaysia stock market. UNIMAS Review of Accounting and Finance, 2(1), 38-61.
Kouatli, I., & Yunis, M. (2021, December). A guide to stock-trading decision making based on popular technical indicators. In 2021 International Conference on Decision Aid Sciences and Application (DASA) 283-287. IEEE.
Petrusheva, N., & Jordanoski, I. (2016). Comparative analysis between the fundamental and technical analysis of stocks. Journal of Process Management and New Technologies, 4(2), 26-31.
Picasso, A., Merello, S., Ma, Y., Oneto, L., & Cambria, E. (2019). Technical analysis and sentiment embeddings for market trend prediction. Expert Systems with Applications, 135, 60-70.